How to interpret a tympanogram
What is a tympanogram?
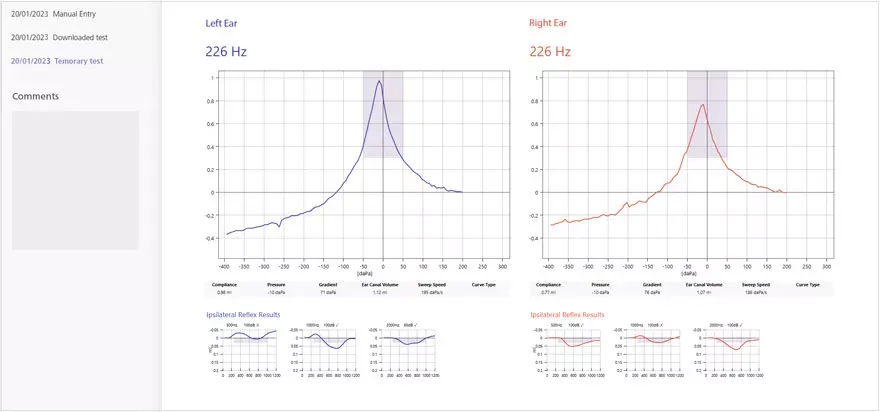
A tympanogram is the output of performing tympanometry. It is a graphical representation of the compliance of the middle ear as a function of air pressure. Tympanograms are typically the results of using a tympanometer, a specialist instrument for accessing the middle ear.
They are useful in audiology and otolaryngology as they check how well the middle ear works and help to diagnose problems such as ear infections or issues with the eustachian tube.
Understanding a tympanogram needs expertise, so it’s best interpreted by audiologists, ear, nose, and throat specialists, otolaryngologists, or other qualified healthcare professionals. They can use the tympanogram results along with other tests to decide how to further treat the patient.
How to interpret a tympanogram
Reading a tympanogram involves interpreting the graph generated by a tympanometry test.
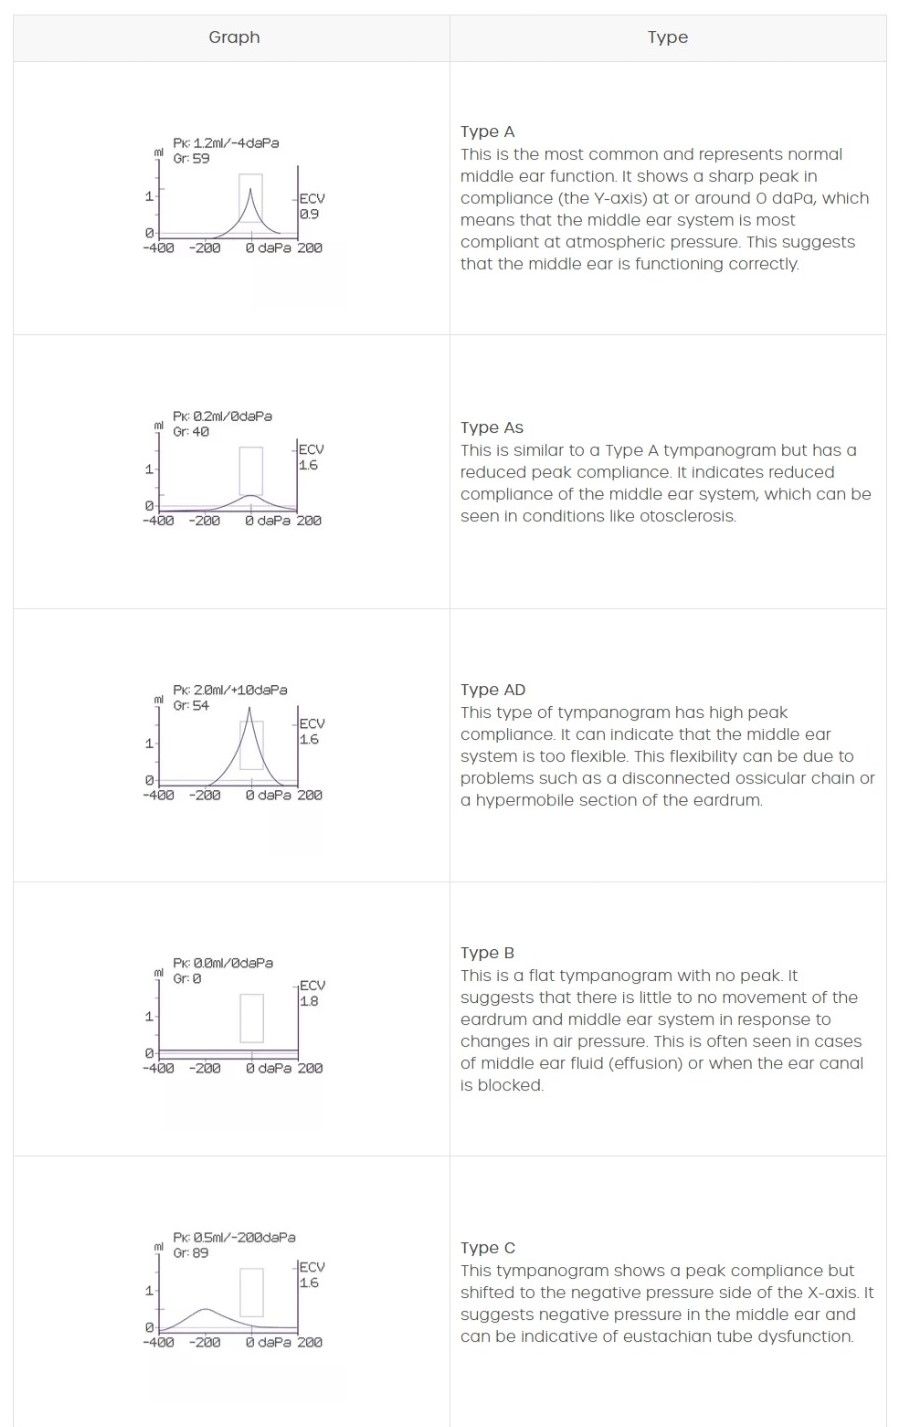
Tympanogram types
There are several types of Tympanogram, each representing different conditions of the middle ear. According to Jerger (1970), the most common tympanometry results are classification type A, B and C.1
Depending on the middle ear condition, it’s important to acknowledge that new variations have been introduced in recent years to better describe and differentiate selected middle ear disorders.
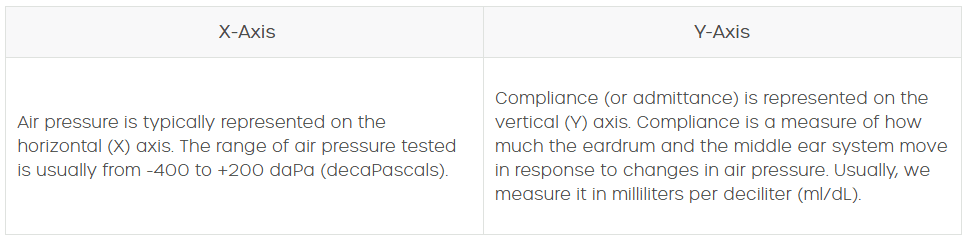
The test frequency also plays an important role in interpreting the test results. The tympanometry curve plots the compliance of the eardrum based on pressure that’s applied to the ear canal.
There are other parameters to assess alongside the test compliance curve. These include the maximum compliance curve values (air pressure in daPa and compliance value in ml), the width of the curve, also called the gradient (in daPa) and the ear canal volume (measured in ml).
The ear canal volume is particularly important, as this value can be used to differentiate between a perforated ear drum (high volume) or an otitis media (regular volume).
Analyse the characteristics:
As well as the type, other characteristics of the tympanogram can provide valuable information when it comes to interpreting results:
- Peak height: The height of the compliance peak indicates the degree of middle ear compliance
- Peak pressure: The pressure at which the peak compliance occurs is important for diagnosing conditions like eustachian tube dysfunction
Normative data:
It’s common to see tympanograms with a normative area in the graph. This is represented as a rectangle in which the peak of the tympanogram should fall in order to be classified as ‘normal’ (Type A). This makes interpretation of the test much easier, as it’s a simple case of visually assessing if the peak is in the box or not.
It’s a good idea to check practice guidelines and recommendations within your local or national authority for which values you should apply in order to see a normative area in your tympanometry results.
Correlate with clinical information:
Tympanograms are just one piece of the puzzle in assessing middle ear function. To diagnose or understand the tympanogram, it’s important to consider the patient’s medical history, audiometry, and symptoms.
Industry-leading tympanometers
We provide industry-leading handheld and desktop tympanometers that provide fast and accurate middle ear measurements for all age groups, including neonates.
Test progress and diagnostic result information are displayed on large LCD displays during and after the automatic test, allowing users to easily interpret results. This information can be easily processed in all methods to support the efficient delivery of customer care.
Our tympanometers also offer single-click integration to third-party Electronic Medical Record (EMR) systems such as Noah, Auditbase, and OtoAccess®. This enables the seamless transfer of results and data for exceptional workflow efficiency.
For more information on our range of screening and diagnostic tympanometers, please visit our tympanometers webpage, contact our customer support team on +44 (0)1698 208216 or email.