To interpret high frequency tympanometry results, including YBG curves, it is important to understand the physical behaviour of the middle ear system and its frequency dependency. Tympanometry is not simply a measure of eardrum mobility but also involves the middle ear structure and, to a small extent, the cochlea. Tympanometry outcomes depend on the ‘stiffness’, the ‘mass’ and the ‘resistance’ in the structure of the middle ear as well as the frequency of the probe tone used.
The behaviour of the middle ear towards test frequencies
The middle ear system can be described as the translator of acoustic sound energy (collected by the outer ear) into mechanical movement, designed to stimulate the inner ear. The physical properties of the middle ear are dependent on the frequency. These properties play an important role in how sounds are perceived and passed on.
The impedance of air is lower than that of cochlear fluid.1 It is similar to the experience of moving in water vs. moving on land. When a sound wave is transmitted via the middle ear, it passes the impedance of the middle ear structure. This is controlled by the elasticity in the tympanic membrane, the ligaments of the middle ear bones, and the compression and expansion of air in the middle ear cavity.
To calculate the impedance of the middle ear system, the same mathematical principles can be applied as when calculating the impedance of a circuit:
Z = R + iX
(Magnitude Z, Resistance R, Reactance X)
Within a circuit, different elements impact the impedance (e.g. resistors, inductors, capacitors). The opposite of impedance is the admittance (also called compliance). The acoustic admittance of the ear drum is directly proportional to the acoustic signal being transmitted into the middle ear. Hence, in tympanometry the admittance (Y) is measured to identify the absorbed acoustic energy of the middle ear:
Y = G + iB
(Admittance Y, Conductance G, Susceptance B)
Two physical properties that influence this translation of acoustic to mechanical movement, are mass (G) and stiffness (B). In general, mass limits high frequency transmission but supports the transmission of low frequencies. Stiffness limits low frequencies but allows high frequencies to be transferred. To put this into more simple terms, the bigger (and therefore heavier) the keys of a xylophone, the lower the sound when hitting the key. The smaller (and therefore lighter) the keys, the higher the sound that is produced.
The ossicles within the middle ear cavity represent mass (G), whereas the elasticity in the tympanic membrane along with the ligaments of the middle ear bones, and compression and expansion of the air in the middle ear cavity, supply stiffness (B) to the middle ear system. Hence, the middle ear bones are responsible for transmitting low frequencies and higher pitched test signals.
Why use different test frequencies
Using the principles of mass and stiffness domination, we can attempt to identify pathology abnormalities within the different middle ear structures. Using different test frequencies, various pathologies can be identified, for example, low test frequencies can identify eardrum pathologies and high test frequencies can identify ossicular abnormalities.
When the frequency of the mass and stiffness is equal, this is the resonance frequency. “The mean resonance frequency of the human middle ear under air conduction (AC) excitation is known to be around 0.8-1.2kHz.”2 This means the transmission of sound will be affected by factors other than the impedance of the cochlea itself. The middle ear is stiffness dominated when below the resonance frequency, and mass dominated when above the resonance frequency (see figure 1).
At low frequencies, such as 226Hz, the middle ear is stiffness controlled. Increase in stiffness is associated with extreme negative middle ear pressure, middle ear effusion and otosclerosis, which also results in low frequency hearing losses. If the mass of the middle ear increases, hearing will decrease in the high frequencies, e.g. due to an ossicular disruption. Therefore, if the mass characteristics of the middle ear need to be evaluated, it’s advised to use a high frequency probe tone.
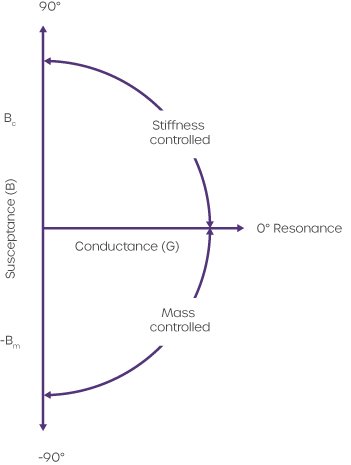
Figure 1: Force (F) – velocity (V) relationships for compliant susceptance (Bc), mass susceptance (-Bm), and conductance (G) depicted on x-y coordinates (from: Shanks J, Shohet J. Tympanometry in Clinical Practice, Chapter 9).
When and how to use high test frequencies
In adults, the middle ear is primarily stiffness-dominated. 226Hz has become the 'gold-standard' for tympanometry tests in adults and children older than 6 months. Research has shown that at 226Hz probe tone, the stiffness dominated part can be ignored (B is close to 0), so that the admittance of the ear equals that of the conductance part.
In newborns and toddlers up to 6 month of age, 1kHz probe tones are being used. In newborns, the ear canal consists of mostly cartilage, leading to absorption of probe frequencies that are too low. In addition, the middle ear resonance frequency of newborns is around or below 500Hz, so a 226Hz probe tone isn’t the right one to use. The ear of a newborn is mass-dominated, which is why a frequency above the resonance is used to identify disorders.
Other probe tones used are 678 and 800Hz and are usually performed in addition to 226Hz to evaluate the middle ear behaviour in high test frequencies.
How to understand YBG curves
In contrast to measurements obtained with a 226Hz probe tone, high frequency tympanograms are interpreted based on their shapes and morphology. In general, the rule of thumb is, if the Y graph looks like a regular shaped tymp, this indicates a normal middle ear behavior. Only when the Y graph looks dissimilar to the well-known tymp shape, do we recommend evaluating the B and G graphs (see figure 2).
| A comparison of susceptance (B) and conductance (G) tympanograms predicted by Vanhuyse et al. (1975) model (Predicted) versus actual tympanograms measured from a 40-year old male with a normal middle-ear transmission system (Actual). The actual tympanograms are from the same person. |
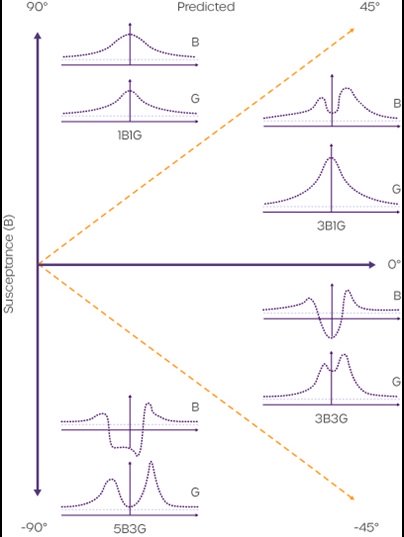 |
Figure 2: see text description as above.
This is used to distinguish between different shapes when reviewing the B-G-shapes of high frequency probe measurements, based on the model developed by Vanhuyse et al (1975).3 There are 4 types of normal B-G-tympanograms for 678Hz measurements, as listed below:
The numbers in the description of each curve represents the number of peaks in the curve, e.g. 1B1G stands for 1 peak in the conductance curve and 1 peak in the susceptance, where as 3B1G would indicate 3 peaks in the susceptance curve. To be considered a normal notched tympanogram, Van Camp et al. (1986)4 created the following criteria:
- Normal notched tympanograms do not occur at low frequencies
- The number of peaks of the curve must not exceed five (susceptance) and three (conductance)
- The pressure difference (in daPa) between the outermost conductance maxima must not exceed the pressure difference between the susceptance maxima
- The pressure difference (in daPa) between the outermost maxima must not exceed 75 daPa in 3B3G tympanograms and 100 daPa in 5B3G tympanograms
Industry-leading tympanometers
Amplivox has worked hard to develop industry-leading handheld and desktop tympanometers that provide fast and accurate middle ear measurements for all age groups, including neonates.
With a compact and elegant design allowing for complete portability, our tympanometers are ideal for mobile use as well as clinical environments where space is at a premium. Including a wide range of test functionality, our devices ensure testing requirements can not only be met, but also exceeded.
For more information on our tympanometry products please visit our tympanometers webpage, contact our customer support team on +44 (0)1865 880 846 or email.
References
1Kim J, Koo M., J Audiol. Mass and Stiffness Impact on the Middle Ear and the Cochlear Partition. Otol. 2015;19(1):1-6. doi:10.7874/jao.2015.19.1.1
2Homma K, Du Y. J Acoustic Soc Am. (2009). Ossicular resonance modes of the human middle ear for bone and air conduction. 125(2): 968-979
3Vanhuyse, V., Creten, W., & Van Camp, K. (1975). On the W-notching of tympanograms. Scandinavian Audiology, 4, 45–50
4Van Camp, K., Margolis, R., Wilson, R, Creten, W., & Shanks, J. (1986). Principles of tympanometry. ASHA Monographs, 24