Spirometry results
Spirometry tests are used to help diagnose and monitor certain lung conditions by measuring how much air you can breathe out in one forced breath.1 They are also used to screen for certain lung conditions where respiratory sensitisers are present within the workplace.
There are several measurements which on first glance can look intimidating, but once you know how to interpret them, they are easier to understand.
The three important parameters to understand when interpreting spirometry results are Forced Vital Capacity (FVC), Forced Expiratory Volume in one second (FEV1), and FEV1/FVC ratio.
Many spirometers will produce the results on a spirometer graph (called a spirogram); Flow/Volume graph and the Volume/Time graph. These graphs are essential for workplace pulmonary surveillance programmes as they can assist in the recognition of lung diseases and test subject errors.
The Flow/Volume graph visually represents the flow of air, measured against the total volume of air exhaled. Whereas the Volume/Time graph visually represents the volume of air exhaled and the length of expiration (in seconds).
Validity and repeatability
Validity and repeatability are achieved by having at least 3 tests that are within 0.150L or 5% or if the spirometer is ATS/ERS 2019 compatible and a test quality grade of “A” or “B”.
Currently, spirometry results compare the actual values of the test with the predicted values for an individual. These values are generated by the spirometer software using stored prediction tables which take in to account an individual’s sex, ethnicity, age, and height. The ‘actual’ best measurement and the predicted value is then used to calculate a % predicted value.
Forced Vital Capacity (FVC)
FVC measures the total volume of air (in litres) that you can expel forcefully from your lungs following a full inhalation. Typically, the FVC predicted is defined by age, height and gender.
The % predicted column compares the total volume of air exhaled during the test against an average of the normal volume for a person of the same sex, ethnicity, age, and height. This is expressed as a % predicted value and normally falls above 80%.
Forced Expiratory Volume in 1 second (FEV1)
FEV1 measures the total volume of air (in litres) that you can expel forcefully in the first second after a full inhalation. Typically, the FEV1 of a healthy male aged between 20-60 ranges from 4.5 to 3.5 litres, whereas the average normal values for a healthy female of the same age range is between 3.25 and 2.5 litres.
The actual FEV1 is compared with the average FEV1 for a person of the same sex, age, and height. In healthy subjects the % predicted value should be above 80%. Ultimately, FVC is the key indicator of restrictive diseases.
Ratio (FEV1%)
FEV1% is an important measurement for determining any airway obstruction, for example diseases such as COPD, chronic bronchitis and emphysema, which can cause reduced airway diameter which will cause a reduction in expiratory airflow and may result in a decreased FEV1%.
The FEV1/FVC Ratio (FEV1%) parameter is the ratio of the FEV1 to the FVC. FEV1% is calculated by dividing the measured FEV1 value by the measured FVC value. The normal value for FEV1% should be above 70%. Percentages lower than 70% are considered abnormal and suggest an airway obstruction.
Restrictive diseases such as pulmonary fibrosis tend to reduce both FEV1 and FVC values to the same extent, so the FEV1% can remain within the normal range, or even increase.
A visual Flow / Volume graph
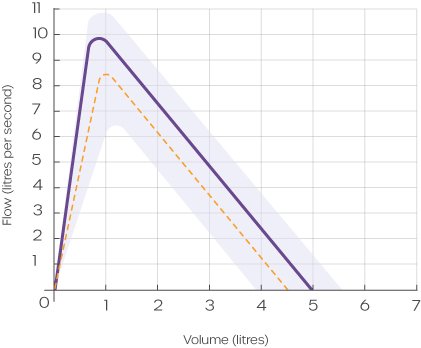
The Flow/Volume graph provides a visual record of the expiration part of the test. The Flow is measured in litres per second and is shown along the Y (left) axis, whereas the Volume is measured in litres and is shown against the X (bottom) axis.
On the Flow/Volume graph you should expect to see a rapid incline at the start of the expiration, which rises steadily to a sharp peak (peak flow, PEF) early in the expiration period (1/100th second). Once the PEF is reached, the curve will descend as expiration continues.
There are characteristics on the Flow/Volume graph that could indicate a problem with the patient’s technique during the test, these include:
- A slow start
- Glottis closure
- A cough
- An erratic flow, with multiple peaks and troughs
The Flow/Volume graph can also reveal patterns which suggest restrictive or obstructive respiratory diseases. Some examples include:
Obstructive; a dip or concave shape as the graph declines
Restrictive; a narrow base, indicating a decreased volume
A visual Volume/Time graph
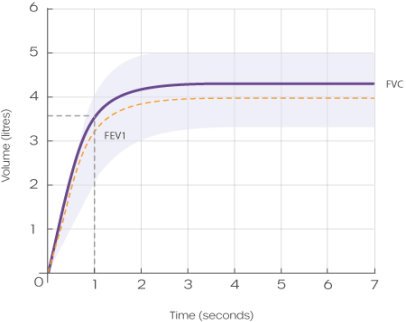
The Volume/Time graph also provides a visual record of the expiration part of the test. The Volume is measured in litres and is shown along the Y (left) axis, whereas the Time is measured in seconds and is shown against the X (bottom) axis.
In normal spirometry, approximately 80% of the air is expelled in the first second (FEV1) of the forced manoeuvre, and very soon after this, the volume will reach a plateau (FVC).
As with the Flow/Volume graph, the Volume/Time graph will also indicate any problems with the patient’s technique.
The shape of the Volume/Time graph can also reveal obstructive or restrictive respiratory diseases. For example:
Obstructive; The FEV1 is reduced however the FVC is normal, thus the FEV1% is down
Restrictive; Both the FEV1 and the FVC are reduced. As both are reduced this results in a normal FEV1%
Interpreting spirometry results
There are various methods for interpreting spirometry test results. The following is a 5-step approach, that when used in conjunction with assessment of the graphs, is a useful way to detect the presence of respiratory disease:
- FVC normal range - is it in the predicted normal value?
- FEV1 normal range - is it in the predicted normal value?
- FVC and FEV1 normal values - it is likely that the results of the spirometry test are normal.
- If either the FVC or FEV1 values are below the predicted normal value, there’s a possibility the patient has signs of a respiratory disease and you should go on to step 5.
- Look at the predicted FEV1/FVC Ratio value. If it is 70% or less, there is a strong possibility the patient has an obstructive lung disease.
As a general rule, the percentages of the predicted values for FVC and FEV1 should be above 80% and the FEV1/FVC Ratio percentage should be above 70% in order to be considered normal. The following lung function test results table can also be used as a guide to help you interpret the spirometry results:
| Spirometry interpretation considerations: |
Normal is classed as the following: |
Validity - 3 tests within 5%/ 0.150L
FVC - Normal (N) or Down (↓)
FEV1 - Normal (N) or Down (↓)
FEV1/FVC% - Normal (N) or Down (↓) |
FVC - Above 80% of predicted
FEV1 - Above 80% of predicted
FEV1/FVC% - Above 70% |
| Parameter |
Normal |
Obstruction |
Restriction |
Mixed |
| FVC |
N |
N |
↓ |
↓ |
| FEV1 |
N |
↓ |
↓ |
↓ |
| FEV1/FVC% |
N |
↓ |
N |
↓ |
Industry-leading spirometers
Amplivox is proud to offer a suite of industry-leading EMR-compatible spirometers to meet the requirements of occupational and respiratory health professionals.
With the inclusion of class-leading spirometry PC database applications, users can benefit from comprehensive data analysis, trending, and transfer capabilities.
For more information on our spirometry products please visit our spirometers webpage, contact our customer support team on +44 (0)1865 880 846 or email.
References
1NHS (2021). Spirometry. Accessible at:
https://www.nhs.uk/conditions/spirometry/
Additional reading
Leach, T (2020). Spirometry. Accessible at:
https://almostadoctor.co.uk/encyclopedia/spirometry
Spirometry.guru. Interpretation of the Flow-Volume Loop. Accessible at:
https://www.spirometry.guru/fvc.html
“Spirometry: step by step”. V.C. Moore. Breathe 2012; 8: 232–240. - September 01, 2022
British Thoracic Society. Spirometry. Accessible at:
https://www.brit-thoracic.org.uk/quality-improvement/clinical-resources/copd-spirometry/
American Journal of Respiratory and Critical Care Medicine. Standardization of Spirometry 2019 Update. An Official American Thoracic Society and European Respiratory Society Technical Statement. Accessible at: https://www.atsjournals.org/doi/full/10.1164/rccm.201908-1590ST#_i36